The product
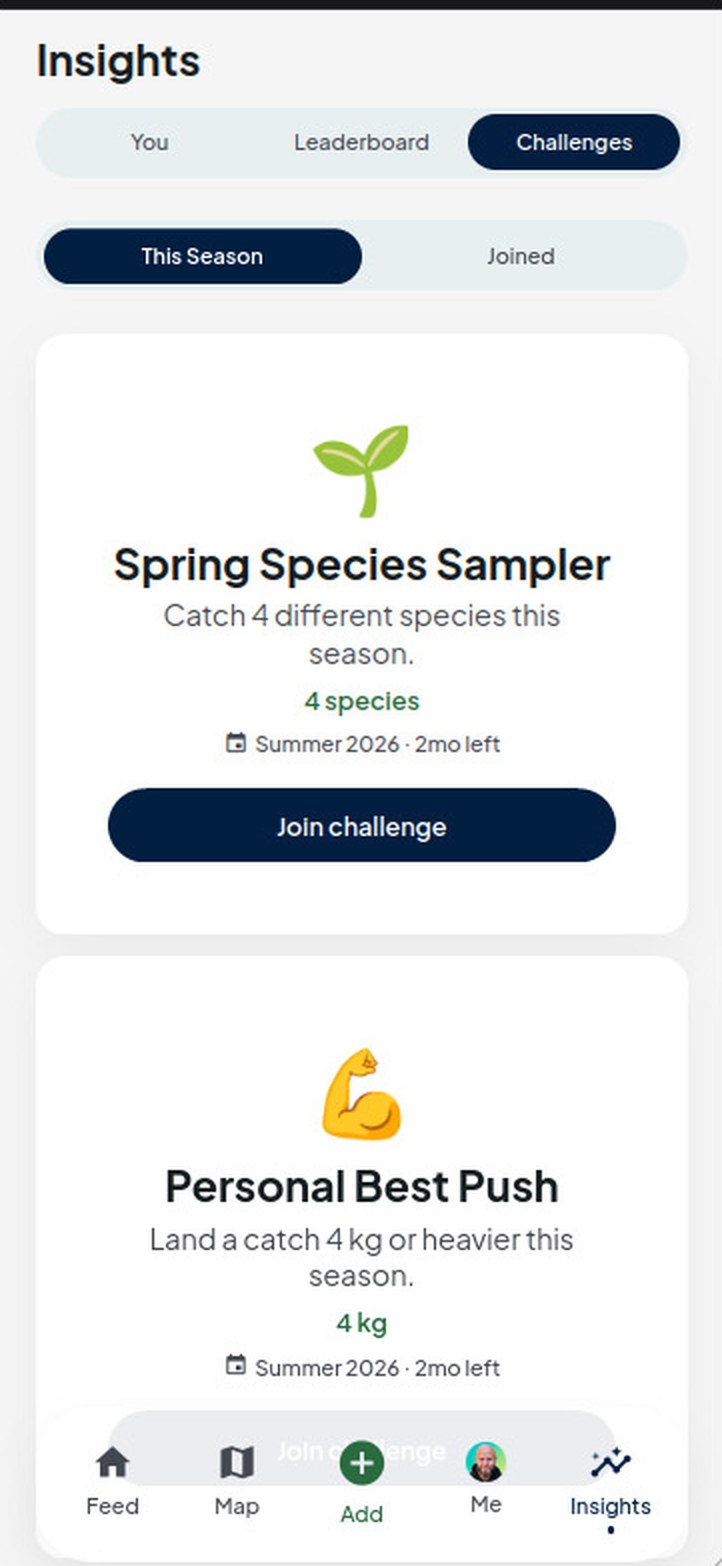
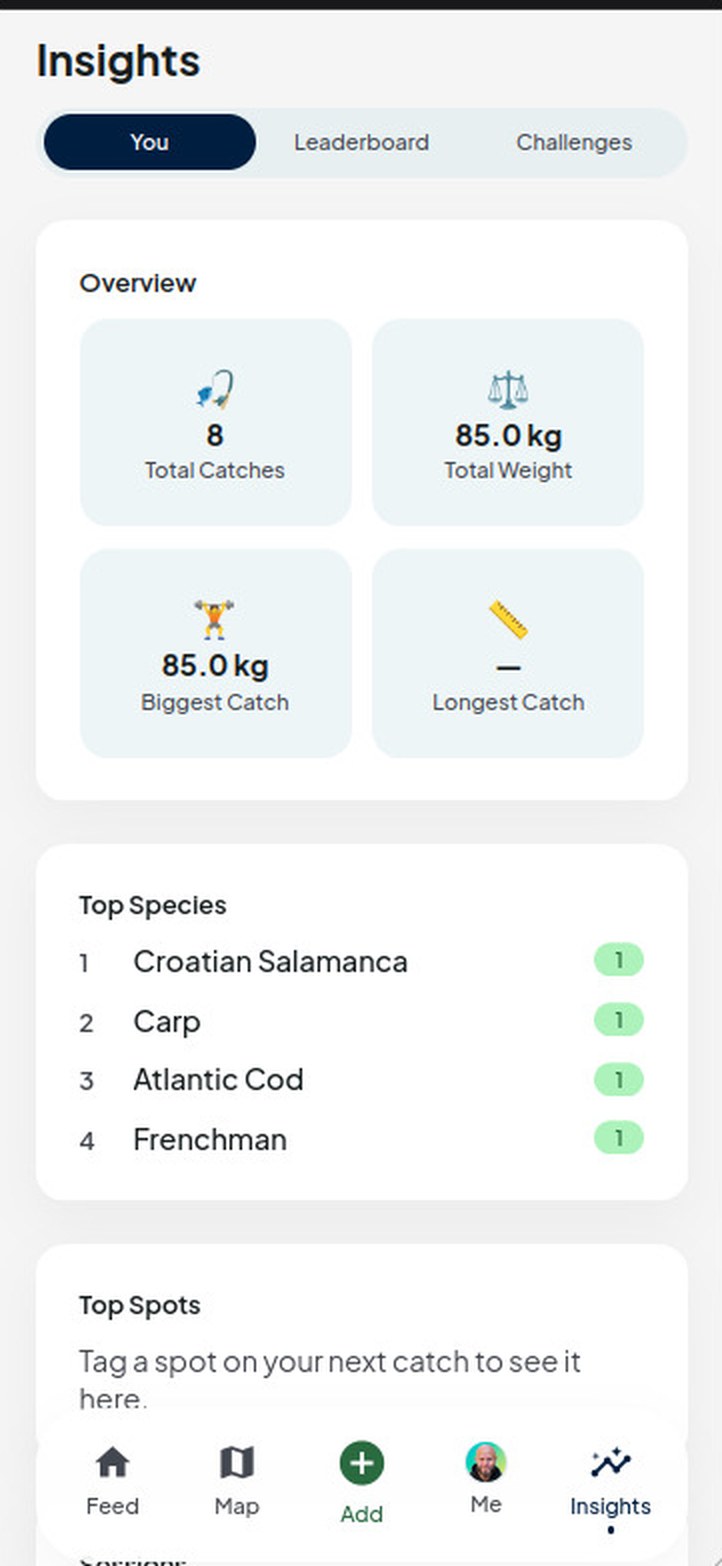
Fishub is a social platform for anglers: log catches, map spots, follow other anglers, and track your own season against challenges and a leaderboard. The social layer is the obvious half of the product — a feed, a map, a profile, and statistics that make a season's fishing legible to the person who fished it.
The part I built: habitat simulation
The interesting problem sits underneath the social product. Fishing apps generally answer "where should I fish?" with crowd data — other people's logged catches. That works where the app already has users and fails completely everywhere else, which is most of the world. It also rewards spots that are popular rather than spots that are good.
I wanted the prediction to be independent of location — to say something useful about a stretch of water nobody has ever logged a catch on, by reasoning about the environment itself instead of about the crowd.
So the simulation models habitat suitability from physical inputs rather than social ones. It pulls environmental data for an arbitrary area — satellite and Earth observation imagery, river flow and water level information, and the surrounding terrain and hydrology — and scores the water within it for how likely it is to hold fish.
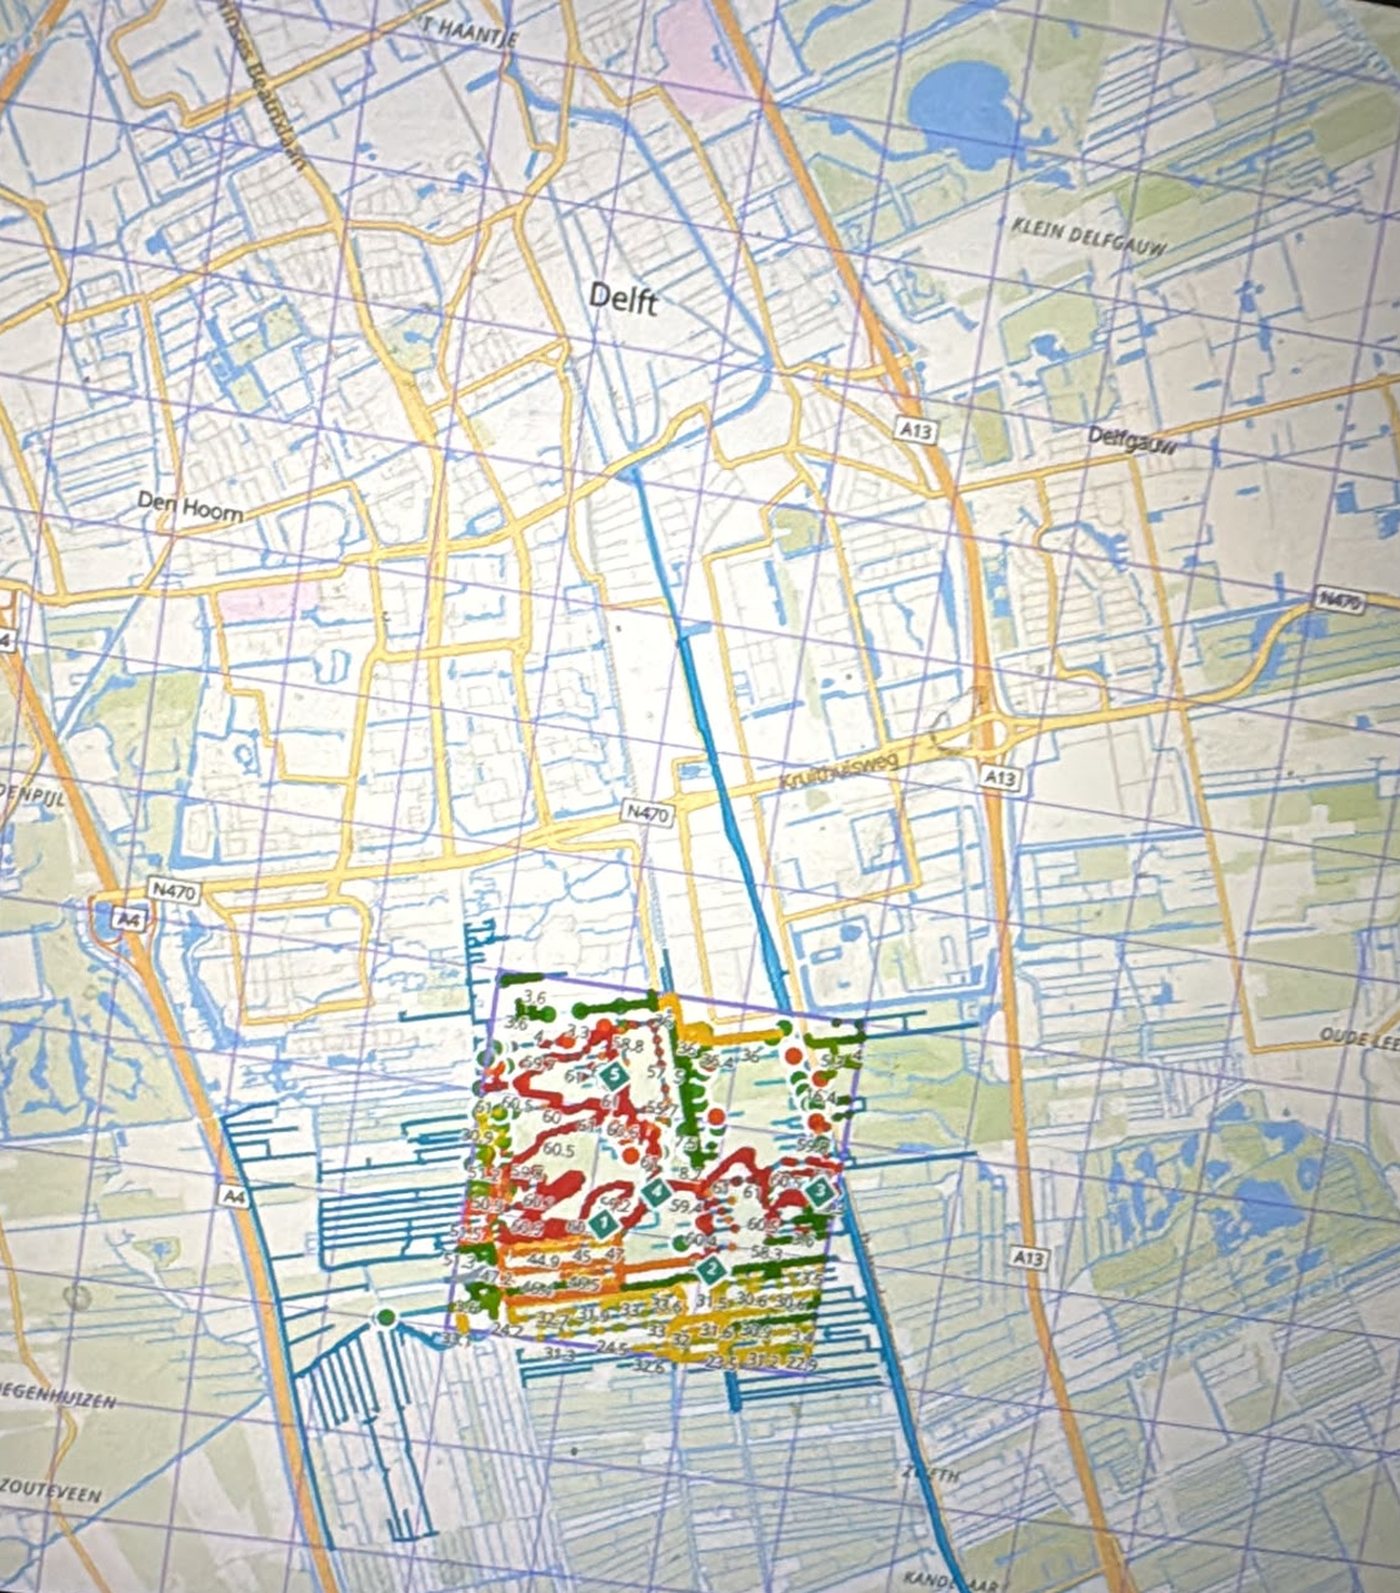
The output is a scored overlay rather than a single answer: an area is divided into tiles, each tile simulated, and the resulting suitability scores rendered across the waterways inside it. Running it over a region produces a heat map of where the environment favours fish and where it does not, at a resolution fine enough to distinguish one stretch of a canal from another a few hundred metres away.
Why this is hard
- The inputs are heterogeneous. Satellite imagery, hydrological gauge readings and terrain data arrive at completely different resolutions, projections and update frequencies, and have to be reconciled onto one spatial grid before anything can be scored.
- Coverage is uneven. River flow data is dense in some countries and absent in others. A model that requires every input to be present is a model that only works in the Netherlands.
- Ground truth is scarce. Unlike a supervised vision problem, there is no labelled dataset of "fish were here". Validation has to lean on known-good water and angler knowledge rather than a held-out test set.
- It has to be cheap enough to run repeatedly. Habitat changes with season, flow and weather, so a prediction is only useful if it can be recomputed, not computed once.
Where it stands
In active development, heading for App Store release. Shipping a real application with three people is as much about scoping, review requirements and release process as it is about code — which is a large part of why the project is worth doing alongside research work.