The problem
Simulate heat dissipation across the surface of a cylinder. The surface is discretised into a 2D temperature grid with halo rows handling the fixed boundary conditions, and each grid point is updated iteratively as a weighted average of its previous temperature and its eight neighbours — four direct, four diagonal.
The arithmetic is trivial. The interesting question is what happens to it in the memory hierarchy once sixteen cores are all touching the same grid, which is why the assignment ran in three parts: write it sequentially in C, parallelise it, then generate memory traces and feed them through cache simulators to see what the hardware was actually doing.
Implementation
Memory layout first
The temperature and conductivity matrices are allocated as single continuous blocks rather than arrays of row pointers, so elements accessed in sequence during the sweep land on the same or nearby cache lines. Constant factors — the relative weights of direct and diagonal neighbours — are precomputed outside the update loop rather than recomputed per grid point.
Between iterations the current and next temperature matrices are exchanged by swapping pointers instead of copying the grid, with halo rows reinitialised after the swap to re-enforce the boundary conditions. Copying a full grid every iteration would have dominated the runtime for no reason.
Parallelisation
OpenMP with collapse(2) on the nested update loops, so the work over the
entire grid is distributed evenly rather than one dimension at a time.
Floating-point reduction needed care. A reduction(+:sum) clause accumulates
the overall temperature sum, but the minimum and maximum use a
manual reduction through thread-local arrays — this keeps the parallel
results numerically consistent with the sequential version rather than drifting with
thread count and scheduling order. Timing uses omp_get_wtime() to measure
genuine wall-clock time in a multicore setting.
The design goal was deliberately conservative: parallelise the existing sequential algorithm with minimal structural change. Larger rewrites kept introducing subtle behaviour differences, and preserving the original logic made it possible to verify numerical agreement against the sequential baseline at every step.
What was tried and abandoned
Dynamic scheduling and a task-based model were both explored for handling irregular workloads. Both added complexity, and trace generation became unreliable — inconsistent thread counts between runs made the cache analysis meaningless. Given the deadline, the simpler static OpenMP implementation was the right call, and it is the one reported. Cache blocking — subdividing the grid so each block fits in cache — was identified as the most promising remaining optimisation but proved too involved to implement in the time available, alongside loop interchange and fusion.
Cache coherence analysis
Memory traces from the parallel simulation were replayed through three cache simulator implementations built earlier in the course: a basic valid/invalid protocol without snooping, the same protocol with snooping, and a full MOESI implementation. Runs covered processor counts from 2 to 16.
Findings
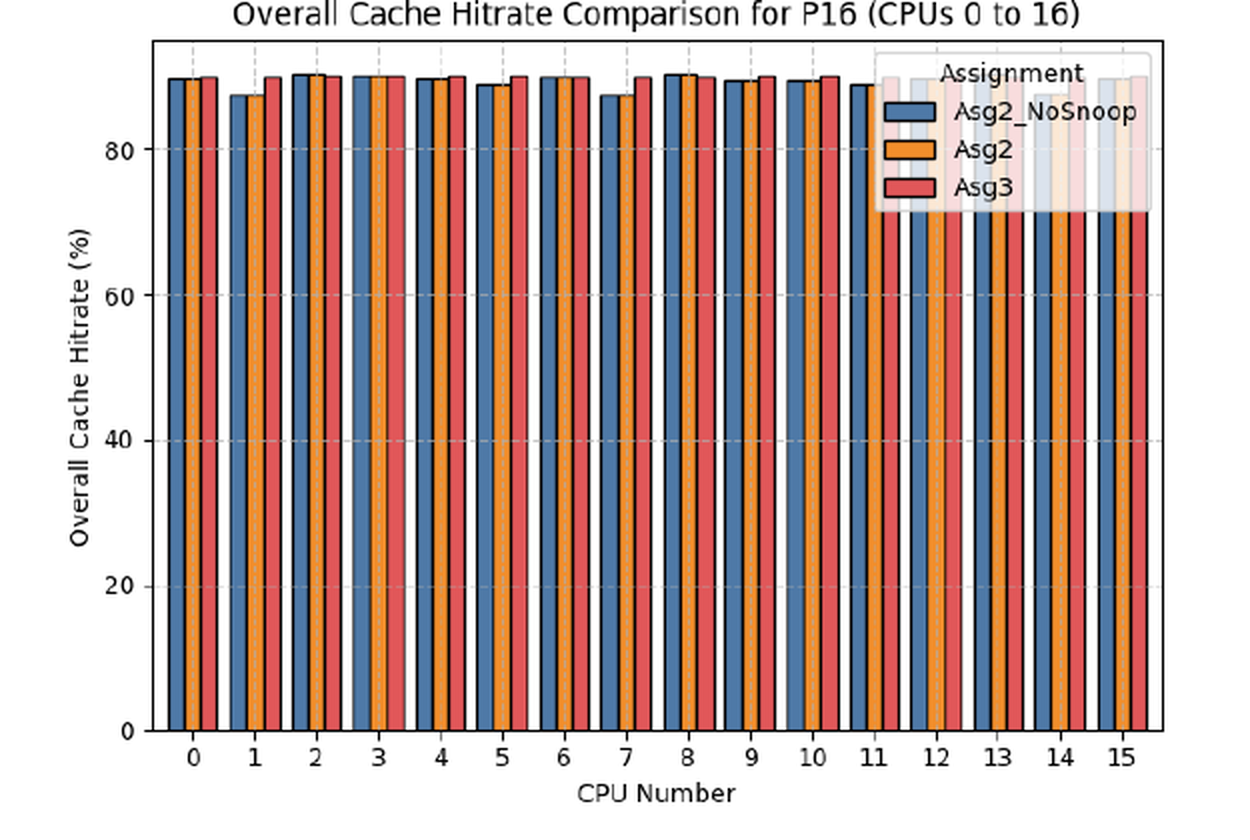
- MOESI wins, slightly, and the gap grows with core count. Its richer set of cache states minimises unnecessary invalidations compared to the simpler valid/invalid strategies. The margin is small at 2 processors and widens steadily through 16 — exactly the trend you would expect if coherence traffic is the scaling constraint.
- Snooping alone barely matters. Hit rates with and without snooping under the basic valid/invalid protocol are nearly identical, which says the overhead snooping introduces does not meaningfully change cache performance when the underlying protocol is that simple.
- MOESI costs bus time. Average bus acquisition time rose under MOESI — unsurprising given it issues more requests than basic valid/invalid snooping. Higher hit rate and higher bus contention are not the same axis, and reporting only the first would have been misleading.
- Hit rates vary between CPUs within a single run, indicating that OpenMP thread scheduling distributes work unevenly enough that some cores take measurably more misses than others.
What I took from it
The memory-layout decisions — continuous allocation, pointer swapping, collapsed loops — are what show up in the hit rates, and they were cheap to implement. The coherence protocol underneath contributes a real but smaller effect that only becomes visible as core count rises. Measuring both, rather than assuming which one dominated, was the point of the exercise.